Health and diagnostics
kweblens answers three different questions about a cluster, and keeps them apart on purpose:
-
Is anything wrong, and which objects? — the deterministic health checks, rendered as the category overviews.
-
Why is this screen empty? — the per-cluster capability report.
-
What should I do first? — the diagnosis, plus four guarded remediation actions.
None of the first two involves a language model. The third involves one only when you press a button.
1. The deterministic checks
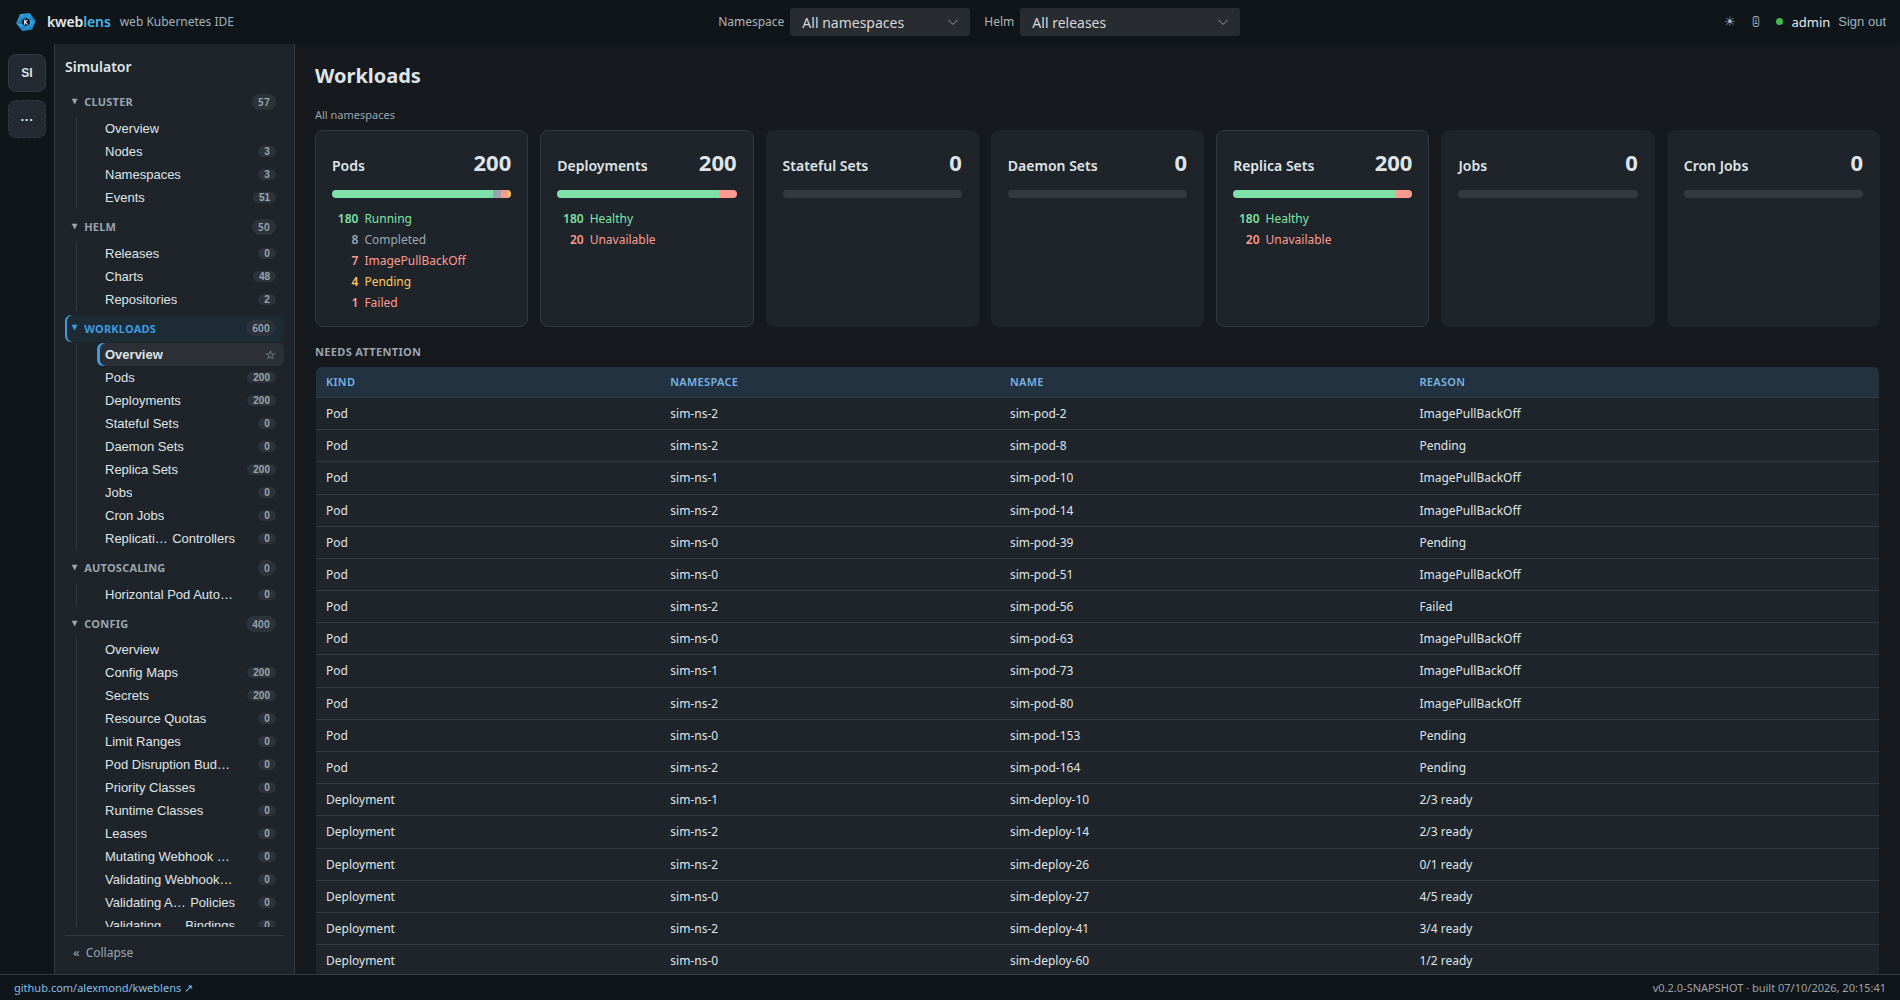
Needs attention names the objects rather than only counting themThe checks live in kweblens-core under health/, so the dashboard, the diagnosis endpoint and
the MCP tools all read the same verdicts. A diagnosis and the Network page cannot
disagree about whether a Service is broken, because there is one implementation.
Each check produces a per-kind summary: total, a per-state breakdown in the kind’s own vocabulary, and the named objects needing attention with a reason each. Counts alone would force the browser to fetch the whole collection anyway to say which objects are unhealthy — which is the transfer the summary exists to avoid.
GET /api/v1/clusters/{clusterId}/overview/{category} serves them, where category is one of
cluster, workloads, network, storage, config. An unknown category is a 404, not an empty
list: an empty list would render as a healthy, empty dashboard.
1.1. Workloads
WorkloadHealth judges seven kinds — Pod, Deployment, StatefulSet, ReplicaSet, DaemonSet, Job,
CronJob. Anything else is reported OK rather than guessed at, and the Workloads overview filters
the nav category down to kinds a rule actually understands, because a kind with no rule would
otherwise be reported as uniformly healthy — a claim rather than a measurement.
| Kind | Verdict |
|---|---|
Pod |
|
Deployment, StatefulSet, ReplicaSet |
|
DaemonSet |
|
Job |
Attention only when the |
CronJob |
Suspended or scheduled. There is deliberately no "last run failed" heuristic — a failed run surfaces as a failed Job, from the object that actually knows it. |
Four states rather than a boolean: OK, ATTENTION, SUSPENDED and IDLE. A suspended CronJob
is an operator’s choice, and colouring it red beside genuine failures is how a health signal earns
its way into being ignored.
1.2. Cluster
ClusterObjectHealth judges the two cluster-scoped kinds on the cluster dashboard — Node and
Namespace.
| Kind | Verdict |
|---|---|
Node |
The |
Namespace |
|
What is deliberately not a state here: the pressure conditions (MemoryPressure,
DiskPressure, PIDPressure) — a node under disk pressure is still Ready, kubectl says so, and
the Nodes list already has a Conditions column; a Cordoned state of kweblens' own, which would
hide whether the node is also ready; and any judgement about what a Namespace contains, which
would be a claim invented here about objects that are not in the Namespace object at all.
Events are not in this category, although they are the third kind in the Cluster nav section. An
event’s Warning/Normal is its type — a field on a report about another object, not a
verdict on the event — so there is no state to count, and the dashboard’s Warnings figure stays a
plain count with the warnings table itself directly beneath it. The category is assembled by
asking StatusVocabulary.covers which kinds have a verdict, so this falls out of the shared rule
rather than being a special case.
The namespace filter is not passed to this category. Both kinds are cluster-scoped, so narrowing them is not a filter that returns fewer — it is a question the API does not answer, and the dashboard says so beside the cards rather than showing filtered and unfiltered numbers side by side.
1.3. Network
One check: Services with nothing answering behind them. The Service exists, DNS resolves,
kubectl shows it as normal, and every request to it fails.
It distinguishes the two causes, which have different fixes:
-
no endpoints— the selector is wrong or the workload is gone. -
n pods matched, none ready— the workload is deployed and failing its readiness probe.
Both come out of one Endpoints list (notReadyAddresses is exactly that signal), so the whole
check costs two list calls, not one per Service. ExternalName Services are always fine: they are
a DNS CNAME with no endpoints by design.
1.4. Storage
PersistentVolumeClaims that are not bound. An unbound PVC is a pod that will never start, and the
pod’s own status points at the claim rather than the cause — so a Pending claim’s reason names
its StorageClass, which is nearly always the question.
Bound claims are also checked for fullness at 90%, but only where the reading is about the claim. See Metrics for why: kubelet reports the filesystem backing the volume, so on a provisioner with no per-volume quota every claim on a class reports the same size. A reading that fails the plausibility check is not used, and the claim is reported as bound rather than flagged on a number that describes a shared disk.
Capacity checks are simply absent when there is no metrics backend. The binding checks stand on their own.
1.5. Config
ConfigMaps and Secrets that nothing in the namespace refers to. This is the one question the Kubernetes API cannot answer directly, and no other kweblens screen answers at all: nothing garbage-collects config objects and nothing warns about them.
It is framed as "not referenced", never as "safe to delete", and the wording matters. The scan covers pods, ServiceAccounts and Ingresses in one namespace, so an object referenced from a controller template whose pods do not exist yet, from another namespace, or from a CRD’s own spec will appear here while being very much in use. Findings are amber, because they are advisory.
Two Secret types are excluded outright rather than listed: service-account tokens (the cluster
owns them) and Helm release records (helm.sh/release.v1), which look unused because nothing
mounts them and are the exact opposite of disposable. Secrets are listed for their names only —
the values are never read.
1.6. Every state on a card is a link, including the three that are not on the object
Each line of a card’s breakdown opens that kind’s list filtered to exactly the objects it counted,
by way of the status: term. A state with nothing in it
stays plain text, because opening an empty list to say "none" is a worse answer than the line.
Three of these verdicts cannot be recomputed from a list row, which is the whole reason the state
is computed on the server and travels with the object: a Service’s needs the Endpoints
collection, a claim’s fullness needs the metrics backend, and a ConfigMap’s needs a scan of the
namespace. So a list request for one of those kinds opens a status context first —
StatusContexts — which fetches that second collection once per request, before any row is
looked at, and every row is then a lookup. It is the same fetch the card already makes, over the
same scope:
| Kind | What the list request additionally fetches |
|---|---|
|
One Endpoints list. Small — an Endpoints object is a handful of addresses. |
|
One |
|
The reference scan — pods, service accounts and ingresses — of which the pod list is the expensive one, and it is cluster-wide when no namespace is selected. This is the one that costs something, and it is exactly what the Config overview already spends to draw the card. |
Fetching per row instead would turn one list request into N, which is the bound
#293 and #302 were spent establishing. If the second collection cannot be
fetched at all, the rows come back with no state rather than the list failing: nothing is
claimed, and no status: term selects them.
The live watch behind an open list re-opens its context at most once every 30 seconds. The inputs to these three verdicts are objects the list is not watching, so no event on the watched kind can report that they changed — a context opened once when the page loaded would still be asserting this morning’s Endpoints tonight, and re-opening per event would turn a busy list into a second stream of list calls.
1.7. "Could not check" is not "nothing is wrong"
Every check reports an error for a kind it could not list, instead of a zero. On a health screen
those two must never look the same. The config check goes further: if the reference scan itself
fails, both ConfigMaps and Secrets are reported as failed, because "0 unused" would read as a
clean result.
2. The capability report
GET /api/v1/clusters/{clusterId}/diagnostics answers "why is this screen empty?". Graceful
degradation is silent by design, which makes it indistinguishable from a broken query, so this
endpoint says which it is. It returns the cluster’s Kubernetes version plus one row per capability
with an explanation:
-
metrics-server — probed by API group (
metrics.k8s.io), never by calling the usage endpoint, because an empty usage result means both "not installed" and "installed with no samples yet". -
Prometheus-compatible metrics — the concrete backend, and how it was chosen. See Metrics.
-
Egress proxy — the proxy actually in force, and whether a configured one is being bypassed. A bypass is reported as not available, because it is the case where the configuration says one thing and the connection does another.
-
Gateway API (
gateway.networking.k8s.io) and Custom resources (apiextensions.k8s.io).
Every probe is guarded individually: an unreachable cluster, or a service account that cannot list Services, must still produce useful answers for the other rows. A probe failure is unwrapped to its root cause, because fabric8 often surfaces a connection failure as the literal string "An error has occurred.", which tells the reader nothing.
GET /api/v1/about is the companion for the instance rather than the cluster: version, build
time, cluster count, security mode, whether the AI is enabled, the pod-file-browser gates. It
never contains a secret — only whether one is set. In open-mode it is a public GET, so the
operationally sensitive fields (admin username, the cluster store’s host path, the file browser’s
allowed roots) are withheld until the caller signs in.
3. Diagnosis
DiagnoseService runs deterministic validators over the current state and returns findings sorted
most-severe-first. Each finding carries a severity (critical / warning / info), a title, the
object, the observed evidence, a suggested next step, a source — and a target.
The object is named twice, deliberately, because one string cannot do both jobs:
| Field | What it is |
|---|---|
|
The display string, for a reader. Its shape varies on purpose — |
|
The same object addressably: |
Where a finding has a target, the UI renders its object reference as a link that opens that
kind’s list filtered to exactly that one object. The filter it builds is anchored
(name:/^web-0$/), because the name: term is a substring match: an unanchored query for
sim-pod-2 also selects sim-pod-20 through sim-pod-29. A finding whose target names a kind
the nav does not know stays plain text rather than offering a link that would go nowhere.
Security findings carry no target today — SecurityFinding.object is a display string in two
documented shapes, and guessing identity back out of it is exactly the parse the target field
exists to avoid. They render as the plain text they always were.
The validators are:
-
Per pod — container-level failures.
-
Relational — the Network and Storage checks above, reused rather than reimplemented. A Service with no ready endpoints and an unbound claim are both invisible on any one object.
-
Warning events — deduplicated to one row per object+reason (the same probe failing 1,600 times is one problem), skipped entirely for objects the checks above already explained, and capped at 15 so one noisy namespace cannot bury everything else.
A Service with nothing behind it is told what to do about the cause it actually has. When exactly one workload carries the selector and sits at zero replicas, the finding is a warning titled "Service points at a scaled-down workload" and the advice is to scale up — the selector is the one thing that is right. When no workload carries the selector, it stays critical.
3.1. A GET never calls a model
This is the rule, and it is not a performance tweak:
|
|
The cache key is the findings, not the scope. A SHA-256 fingerprint is computed over every field of every finding, in order, with unambiguous separators. The deterministic findings are the model’s entire input, so a hit means the model would be shown exactly what it was shown before — and a cluster that has changed is a miss rather than a stale verdict. Cluster and namespace alone would serve yesterday’s opinion about a cluster that has since been rolled.
The summary endpoint is a POST because it is write-shaped, not because it writes: it spends
money and ships cluster state to a third-party inference provider. That puts it behind the admin
login in both security modes, and it is audited. Panel mounts and namespace switches used to buy
an analysis each; now they cost nothing.
The read tells you what it is showing rather than letting an old reading pass as current:
| Field | Meaning |
|---|---|
|
The prose, or |
|
Whether a summary is being shown. |
|
When this scope was last analysed, whether or not the summary survived. |
|
This scope has been analysed, but the findings changed, so the old summary is deliberately withheld. |
|
Whether triggering an analysis could do anything here. False means do not offer the button. |
The cache is in-memory and per-process, capped at 64 scopes with least-recently-read eviction. A restart empties it and a second replica has its own. That costs one more inference call, never a wrong answer. There is deliberately no endpoint to clear it: a summary is already discarded the moment the findings change, which is the only invalidation that means anything.
3.2. AI enrichment is inert by default
The LLM path requires kweblens.ai.enabled=true and a configured Anthropic API key. Without
both, analyse() returns a 409 (ai-unavailable) — nothing broke and nothing was spent, and the
caller could already tell in advance from aiAvailable on the read.
When it does run, the model is given the findings grouped by distinct problem, not one line per object, with exact per-group counts, up to 15 named objects per group and up to 4 distinct evidence messages. It is capped at 25 distinct problem groups, and when the cap bites the truncation is stated in the answer rather than happening silently. The model is asked for judgement only — one next action and at most three bullets, 90 words — because the reader can already see a table of every finding directly below it.
The model never invents state. It reasons over observed evidence, and if the call fails the deterministic findings are returned alone.
4. Remediation
RemediationService turns findings into proposed fixes. The safety model is not negotiable:
|
Suggest → approve → apply. Never autonomous, always audited, all writes behind auth. Proposing is read-only. Applying requires an explicit |
GET /api/v1/clusters/{clusterId}/remediations proposes; POST …/remediations/preview asks the
cluster what would happen; POST …/remediations/apply carries it out. Both POSTs require the
admin login, even in open-mode.
The four actions:
| Action | What it does | Offered when |
|---|---|---|
|
Deletes the pod so its controller recreates it. |
The finding is |
|
Stamps the workload’s pod template so its controller replaces every pod under its update
strategy, honouring |
Same finding titles, plus a resolvable owning workload. Offered alongside |
|
Reverts the workload to the revision before the current one. |
The finding is a template failure — a bad image, a missing config reference, an OOM kill, a crash on start — and the workload has rollout history. Scheduling failures are excluded: the previous template usually does not change the scheduler’s verdict either. |
|
Sets |
A Service has |
Every action is gated on a precondition that says when it cannot work. A proposal that cannot work costs an operator a confirmation, a change to a running system, and the time to discover the symptom is unchanged — strictly worse than proposing nothing.
Workload-level actions need a namespace to resolve the owning object in, and a finding carries
only Kind/name. So a cluster-wide diagnosis proposes only the pod-level action rather than
guessing across namespaces.
4.1. Know which preview is real
The preview is where "suggest → preview → confirm" is easy to overstate, so kweblens returns one of three distinct outcomes rather than flattening them into a string:
| Outcome | Meaning |
|---|---|
|
The patch went to the API server with |
|
Same request, and the server refused it. The rejection is the useful answer — exactly what the operator needed before approving — so it is rendered as a result, not an error. |
|
The cluster was not asked, and the detail says why. |
Which action gets which:
-
scale-upandrollout-restartare patches, so they get a real server-sidedryRun=All. -
restart-podandrollbackcannot. A DELETE is not a patch, and a rollback is resolved from the workload’s revision history rather than sent as one. Both returnNOT_CHECKEDnaming that reason.
Saying "we did not check" is the design, not an omission. A hand-written sentence prefixed
dry-run: describes what kweblens intends, which is a different claim from what the cluster would
allow — and the difference is precisely what the operator is being asked to approve.
A new remediation action must pick one of those two shapes. Never narrate a third.
5. Related
-
Metrics — the backend behind the capacity checks and the charts
-
Editing and applying — the YAML editor’s own dry-run diff
-
Security and identity — what "behind auth" and "audited" mean here
-
REST API — every endpoint named above